What is Q-Traf ?

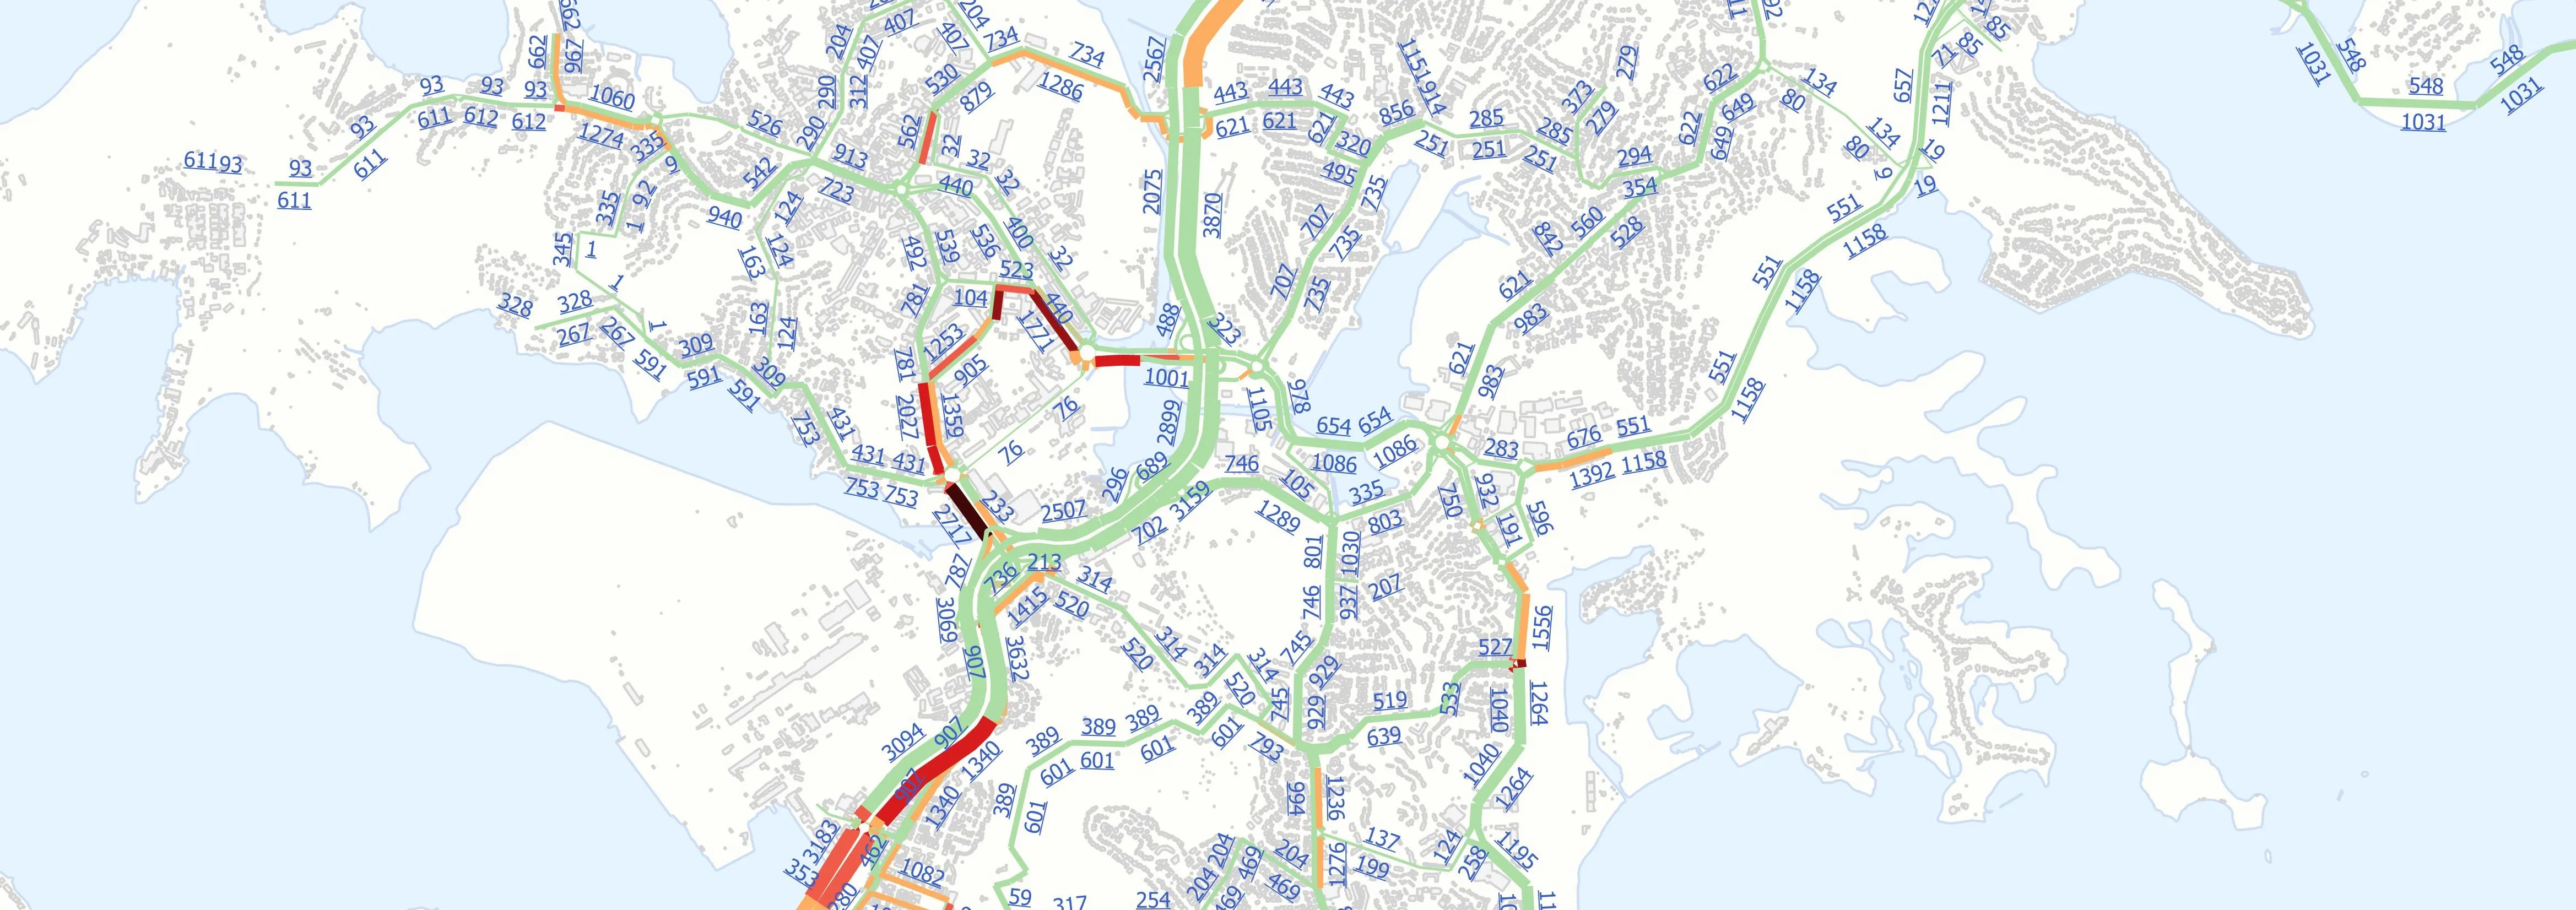
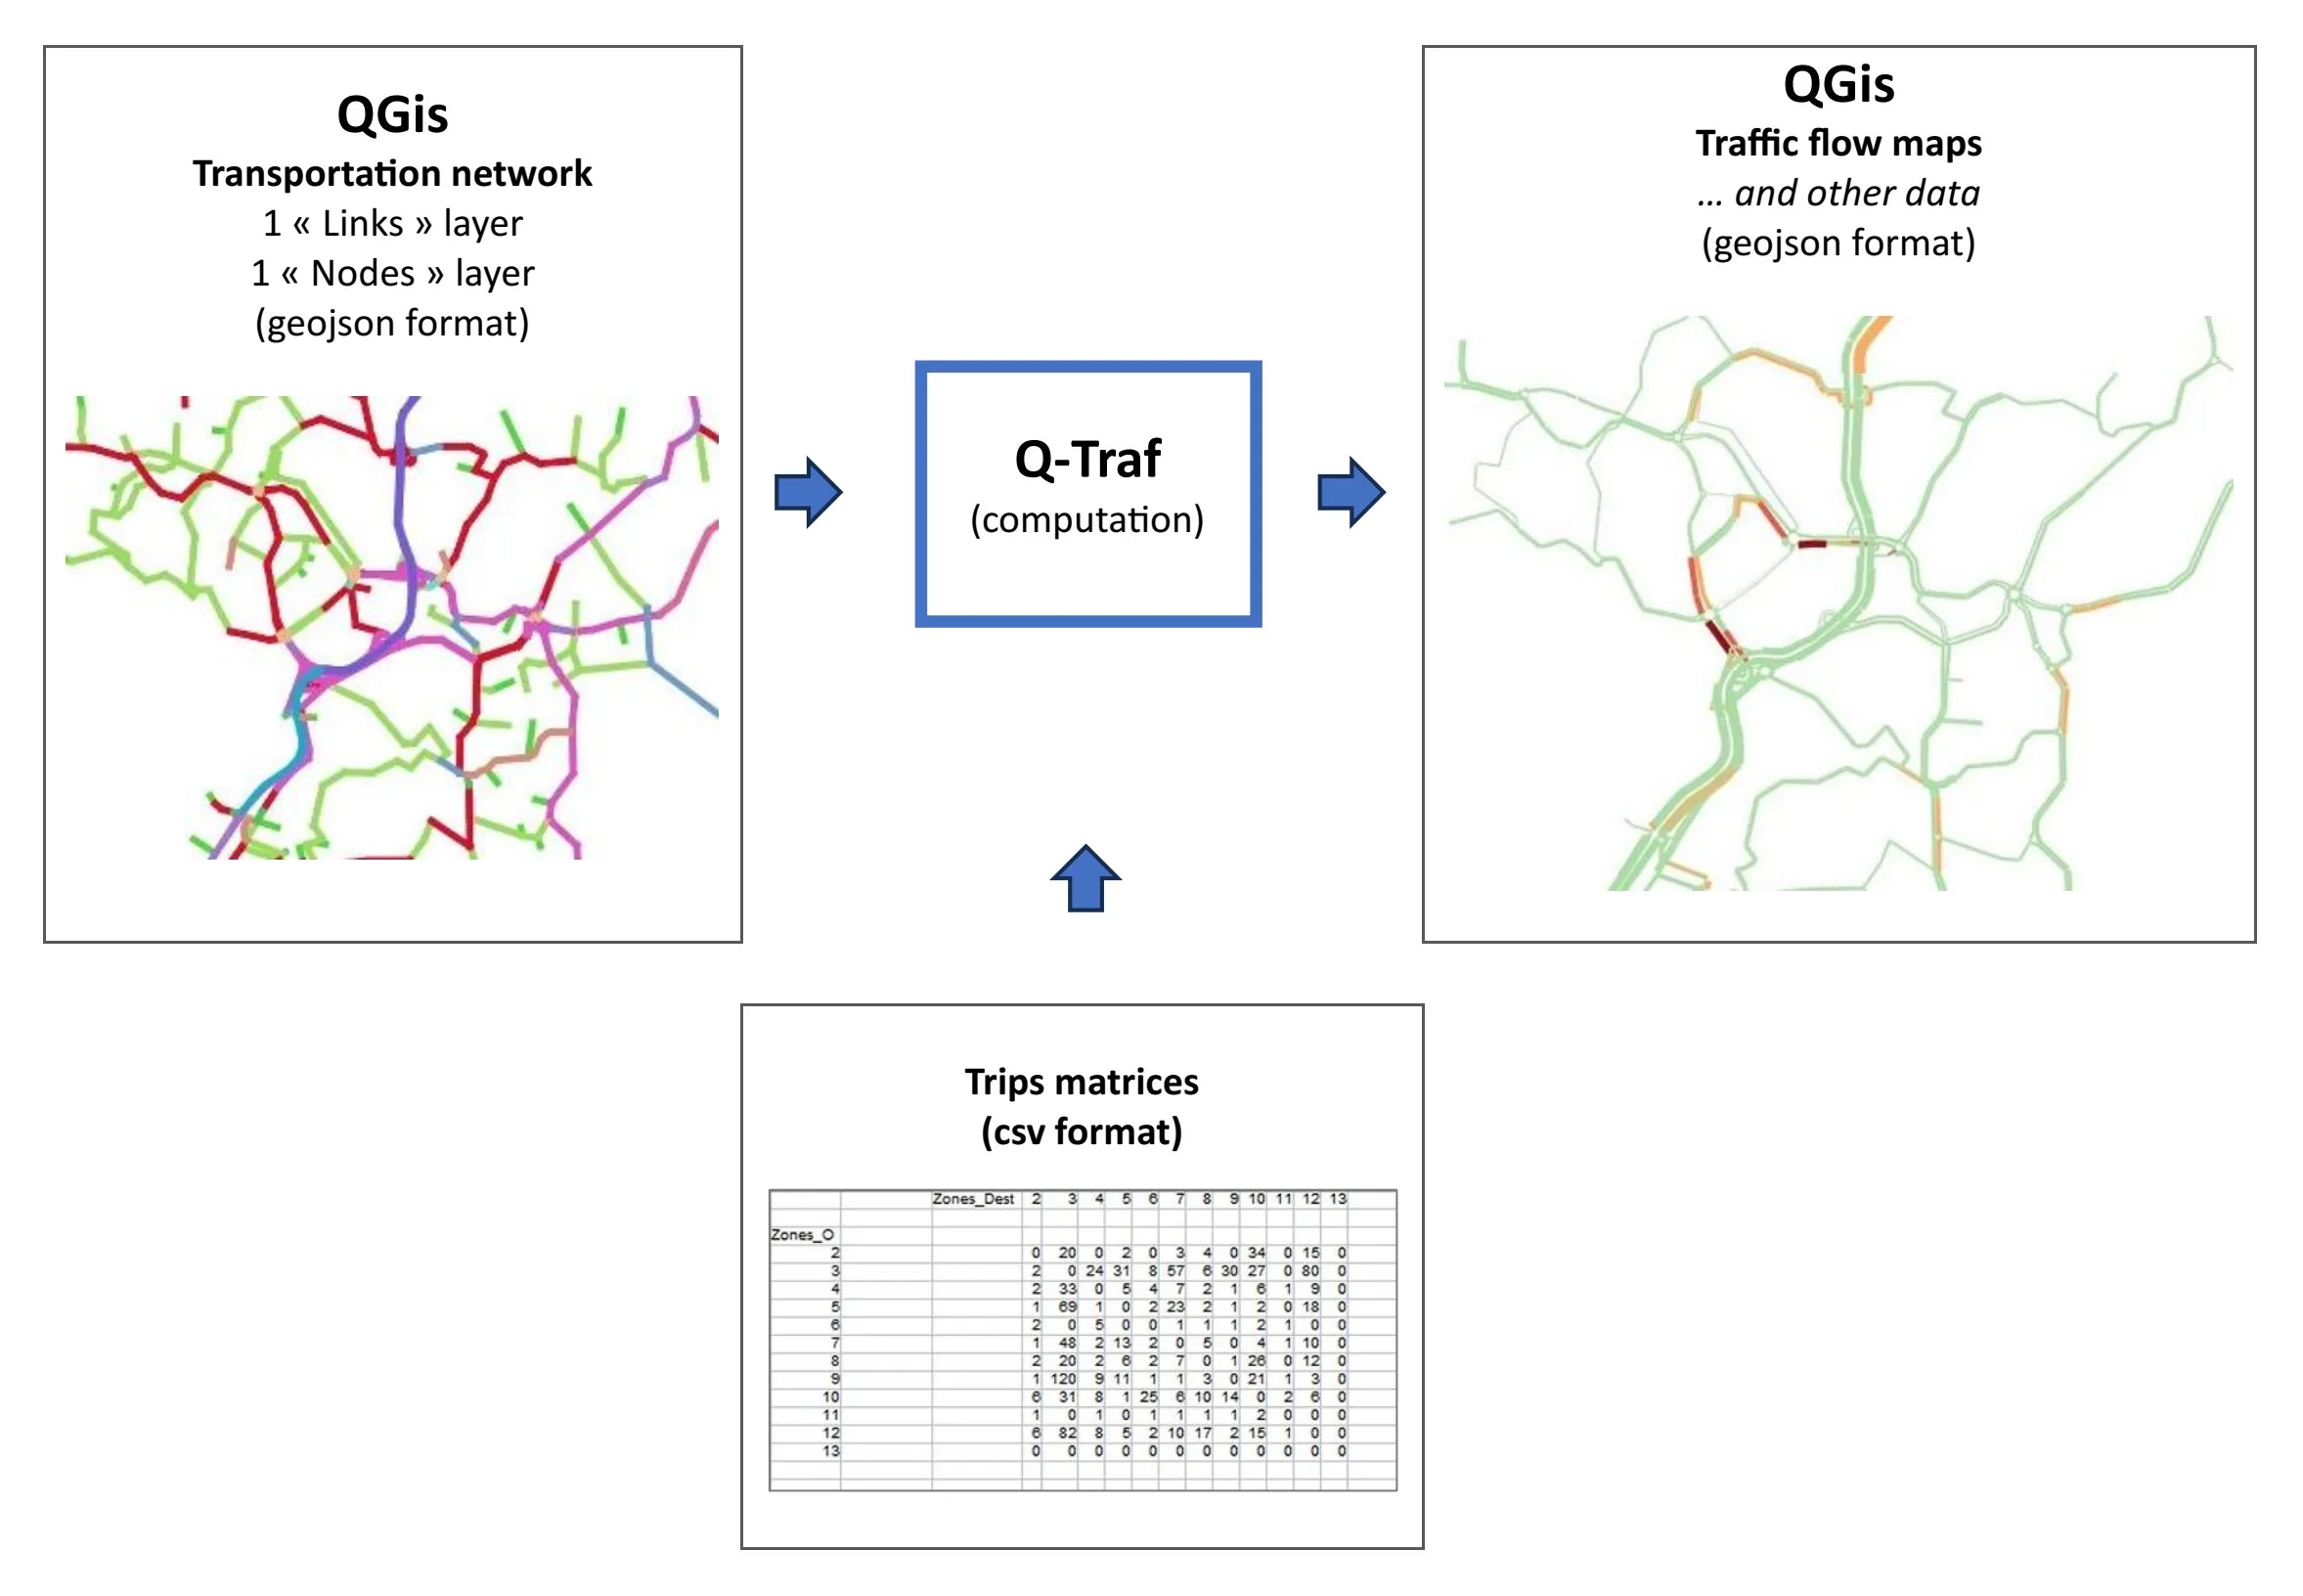
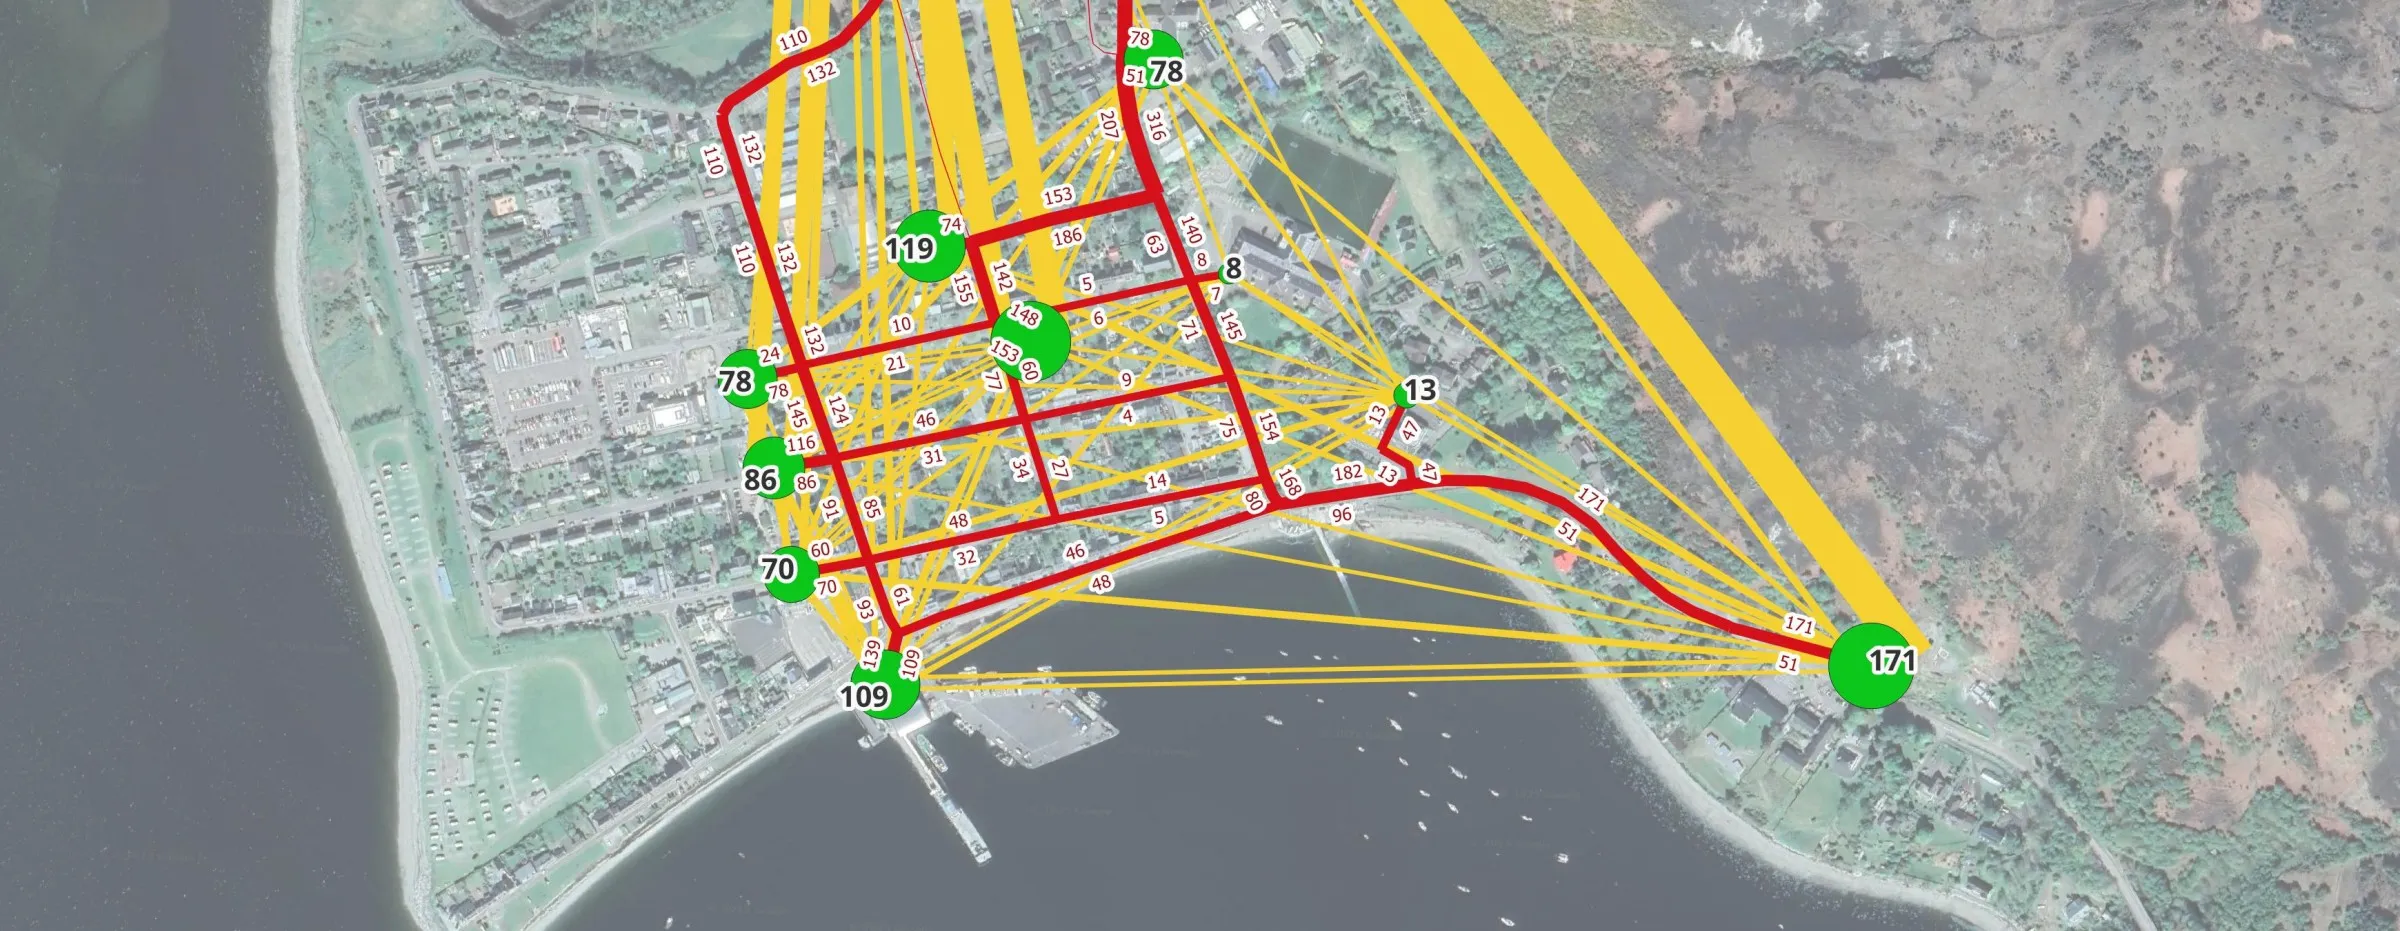
Q-Traf is a trip-based macroscopic traffic model which calculates and draws traffic flow maps (QGis layers), based on Origin-Destination (O/D) trip matrices, by calculating the best route for each vehicle (“assignment”). “Traffic assignment” is the final step of the “4-steps” urban / transportation modelling.
Q-Traf can manage large scale network, with more than 30 000 links, 2 000 zones, dozens of matrices and 10 different vehicle categories.
Apart from the demand (trips matrices), a large scale road network can be modelling in a day or less if a GIS road layer is already available.

Why Q-Traf ?
There are already a lot of traffic or trips programs.
The strengths of Q-Traf are :
- All the road network modelling and data visualization is done with QGis
- Free , without commercial purpose.
- Simple. As it could be
- No coding required.
- Simple open file formats only : “*.csv” (parameters and matrices) and “*.geojson” (QGis layers)
- Portable. No installation required.
- Lightweight. Only 5 Mo
A brief history
Q-traf has been developed over the years, starting in 2014 with a simple Dijkstra algorithm and delay(flow) functions.
Q-Traf has been developed through years of case studies, aiming to do the better use of QGis (for all the modelling and graphic visualization) and to remain the most user-friendly possible.
Performance and limitations
Q-Traf runs on Windows 10 and 11.
It can handle up to :
- 30 000 links
- 2 000 zones
- 4 main categories of road vehicles (car, truck, bus, pedestrian), 9 sub-types, and 16 matrices
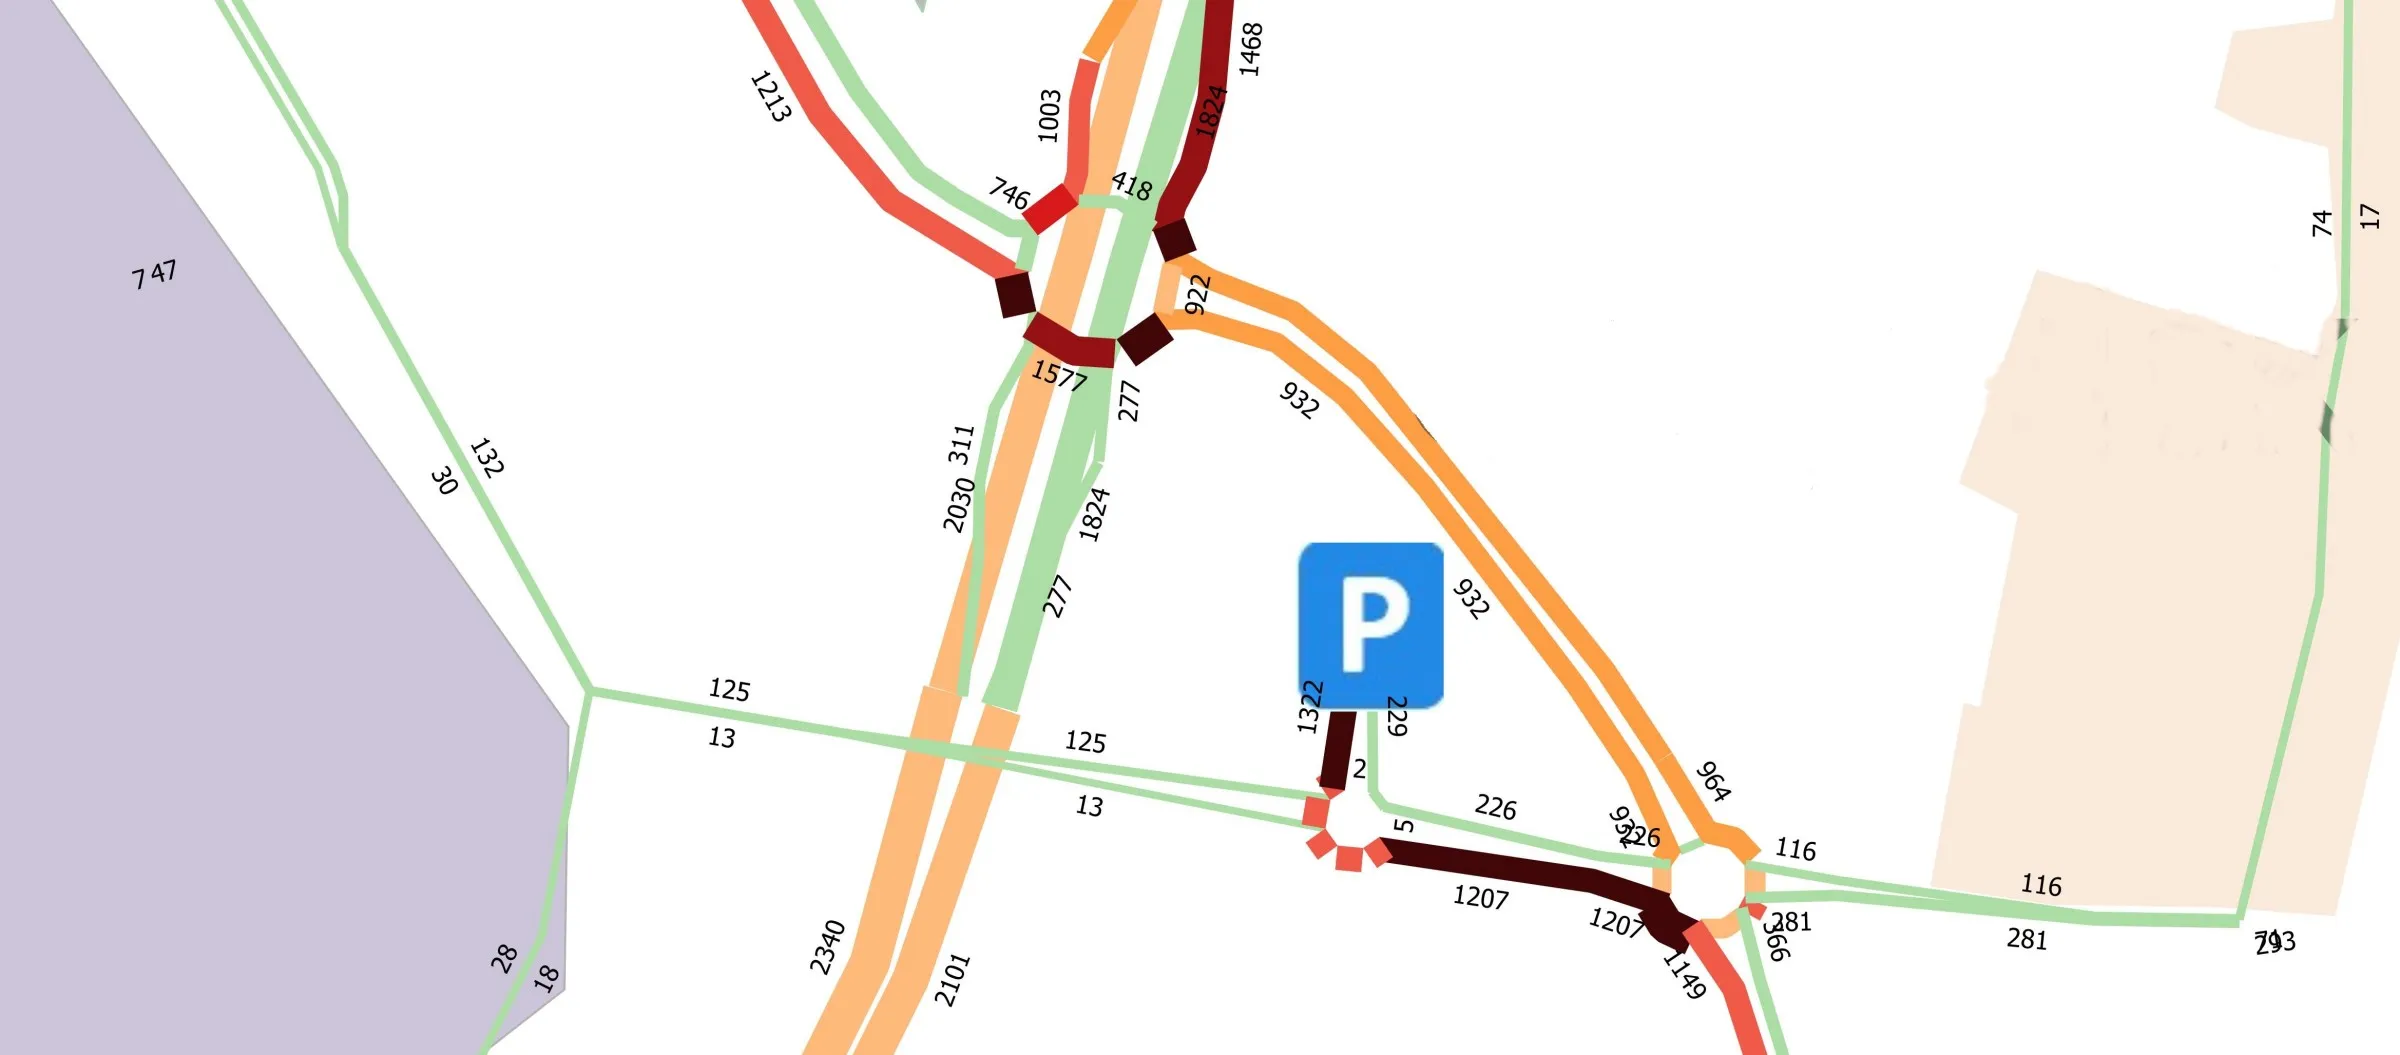
- Park & Ride (car-bus trip)
- 40 scenarios (sets of networks + matrices, for comparison)
- LHD and RHD
- Day and hour analysis
- provides traffic flow, density, per vehicle type and PCU (Passenger Car Unit), zone analysis
(computing 20 000 links and 2 000 zones requires 2 Go of free RAM)
The graphical results are only limited by what a Gis can do.

Traffic assignment – Method and principles
The basis of the program are :
- Method of assignment : MSA (Method of Successive Averages) algorithm. “All or nothing” (for 1 iteration) to “user equilibrium” (the more iterations)
- link delay / performance functions
- generalised travel cost (based on delay, distance and penalties)

Cookie and Privacy Policy
Who are we ?
https://q-traf.com. Hosted on the courtesy of Oceavia, New Caledonia.
Cookie
We don’t track you. But we cannot prevent your device’s IP address from being seen by the internet service provider, our hosting provider, or other internet providers.
