QGis graphic parameters
Q‑Traf outputs are provided as QGIS layers. These layers contain all the necessary data, but they remain invisible or incorrectly displayed in QGIS without the appropriate graphic parameters (link widths for traffic volumes, color codes, and directional offsets to avoid overlap between both traffic directions). Because these parameters are not included directly in Q‑Traf or its output layers, this page explains how to configure them to correctly visualize the results in QGIS (the complete example datasets available on the Downloads page already include these graphic settings).
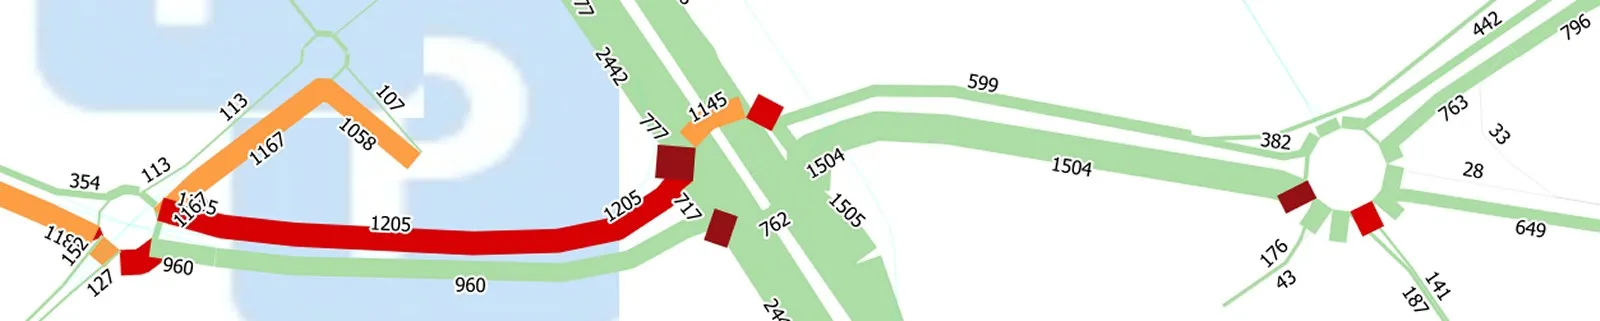
In property > Symbology > Simple Line :
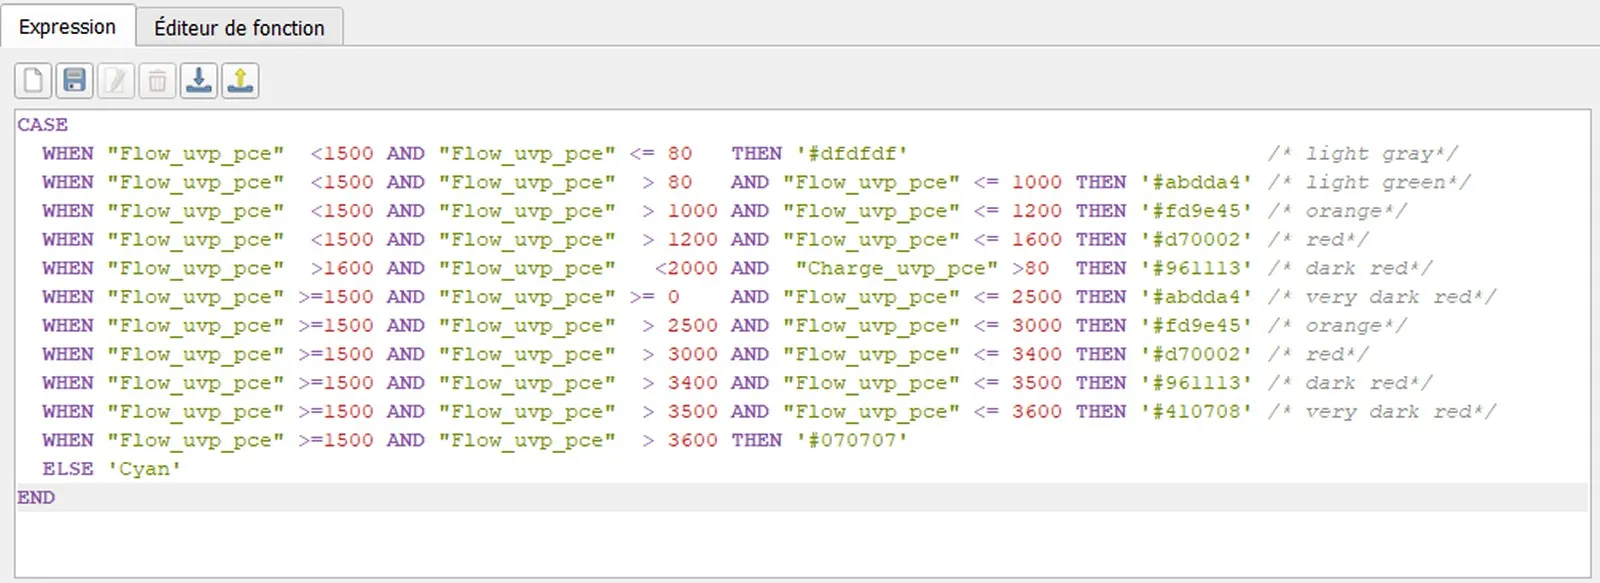
Color line
Color Edit > Edit
Line width / thickness :
The width of the line is proportional to the flow (for instance : 100 * “Flow_uvp_pce”). Here’s an example of a little more complicated function which allows to zoom in / out thanks to adding the “@map_scale” parameter of QGis :
Line width > Edit :

Line offset :
The line offset (to the right or the left of the center) is half the width / thickness of the line. So it’s simply the above function, divided by 2 (multiply by (-1) if it is on the “wrong” side) :
Line offset > Edit :


QGis plugins
Some plugins have been developed to make using QGis easier and faster, as part of the Q-traf project. They are not necessary, but can help. They can be downloaded with the Plugins Manager in QGis.
Round_Coordinates
http://plugins.qgis.org/plugins/Round_Coordinates/
Round all the coordinates of a polyline layer / the “road network” to the nearest meter, without decimals.
Show_All_Layers_CRS
http://plugins.qgis.org/plugins/Show_All_Layers_CRS/
Opens a pop-up window listing all the layers with their CRS, name files and number of features.
In a large QGis project with many layers, this helps to identify layers with a different CRS from that of the project, which slows down the whole process. The contents of the pop-up window can be copied/pasted as text.