
The Hanoi road network
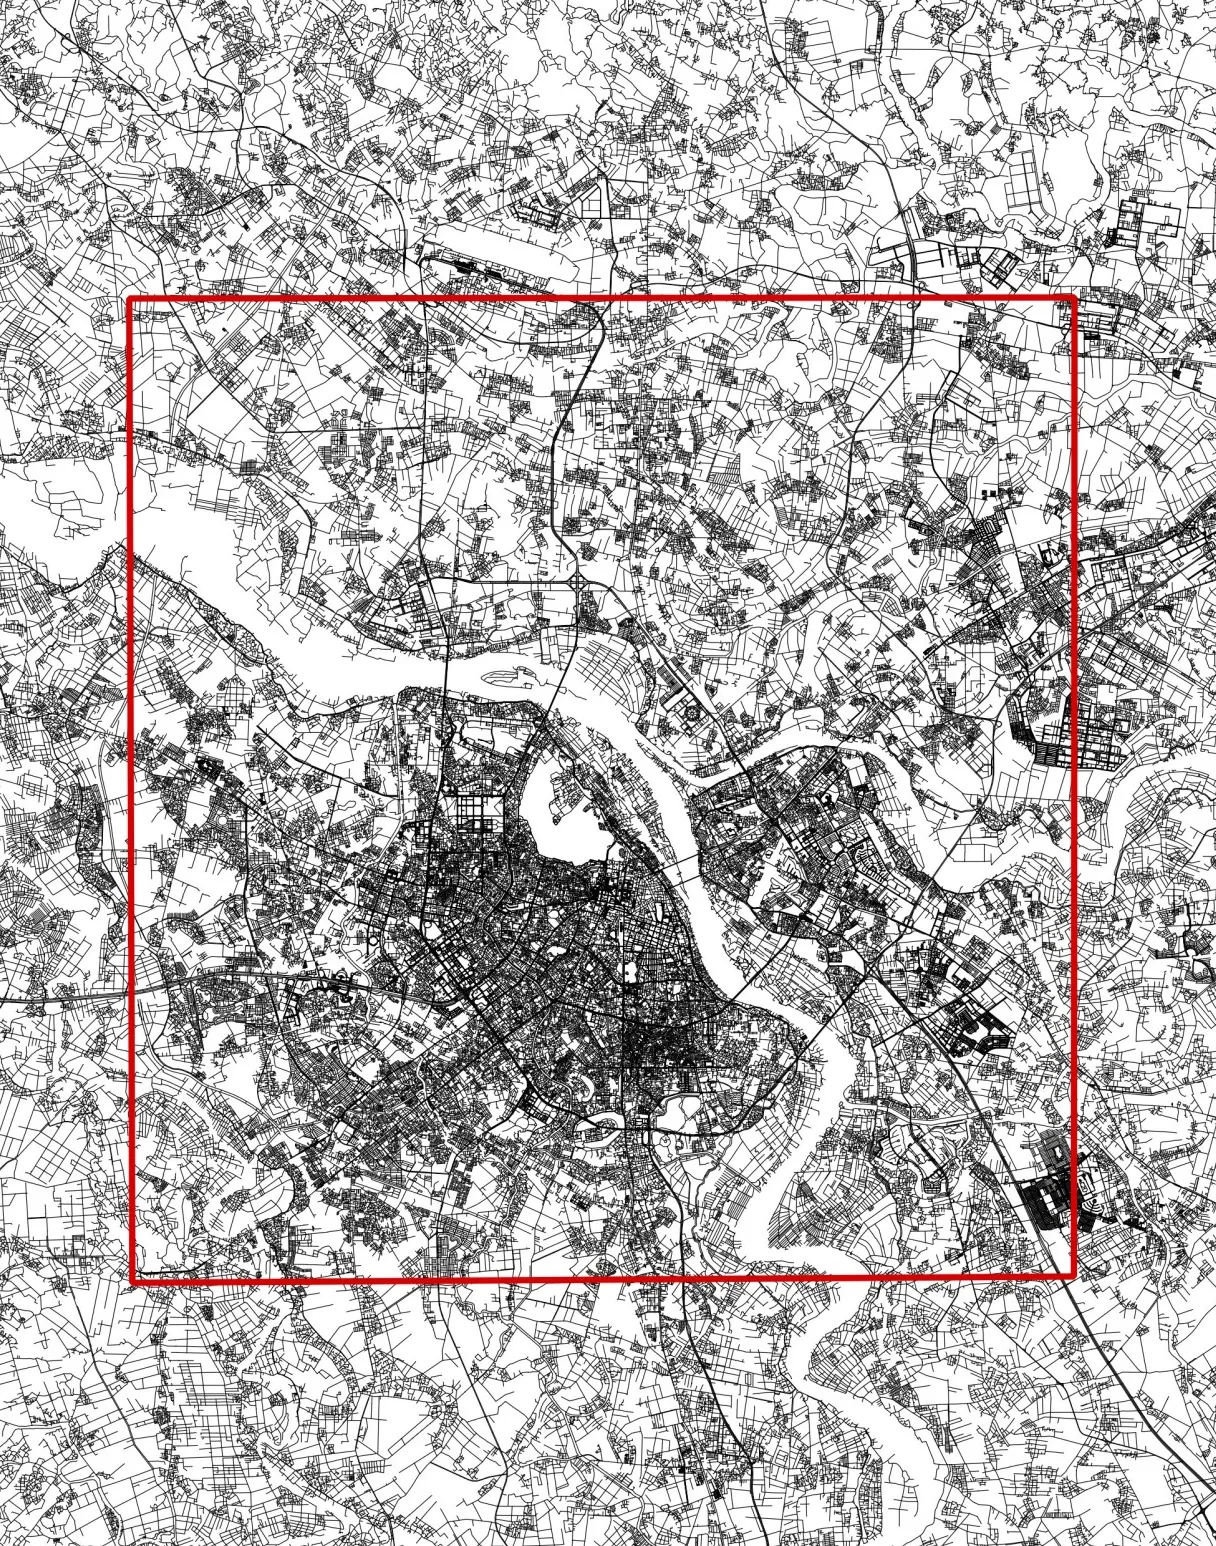
This guide explains how to build the “Road Network” and “Zones” layers (QGIS vector layers) for traffic modeling with Q-Traf, and perform some “assignments”. Hanoi was chosen to demonstrate the software’s capabilities because of it’s massive metropolitan area. Hanoi is the capital and second-most populous municipality of Vietnam, with an area of approximately 3,400 km² (1300 mi²) and a population of nearly 9 million as of 2025 (Wikipedia 2026).
Hanoi (OSM)
How to build a macroscopic traffic model and calculate this road traffic map :

In retrospect, this city presents several challenges :
- The center of Hanoi is dominated by two-wheeled vehicles (motorcycles/scooters)
- There are many complex junctions on two or even three levels
- Numerous roads and peripheral areas are currently under construction
- Crucial information is often not freely available. There is limited data regarding traffic flow direction, one-way streets, or forbidden maneuvers. Furthermore, the resolution of satellite imagery (Google Earth, Bing, etc.) available directly in QGIS is often lower than the original sources.
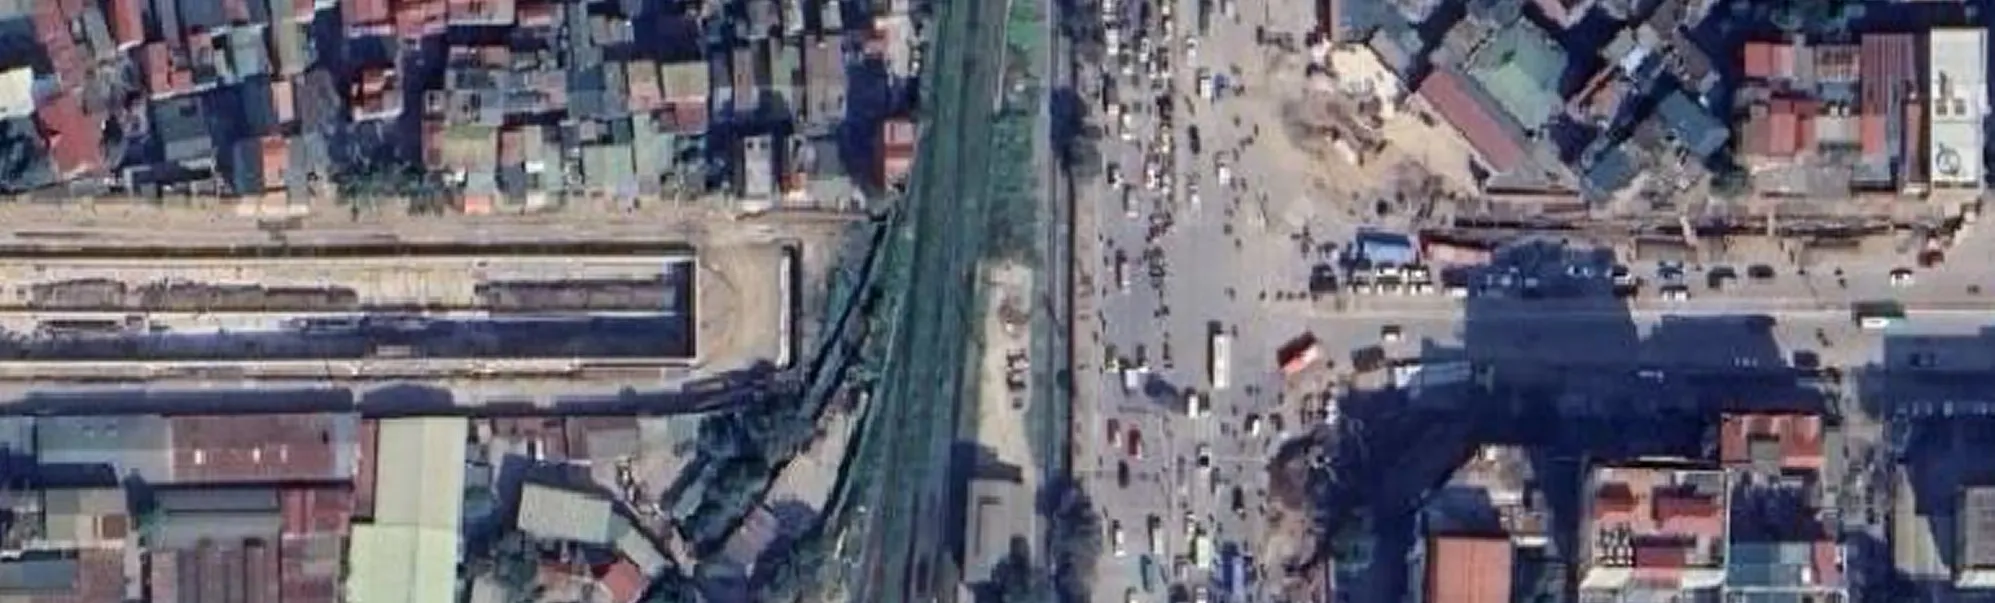
Here an example of a complex urban junction with three distinct levels :
- Two elevated roadways (flyovers)
- Ramps on each side
- Side alleys
- A ground-level route under the elevated section, difficult to see

Many projects are in progress :
Step 1 : Finding a Base GIS Layer
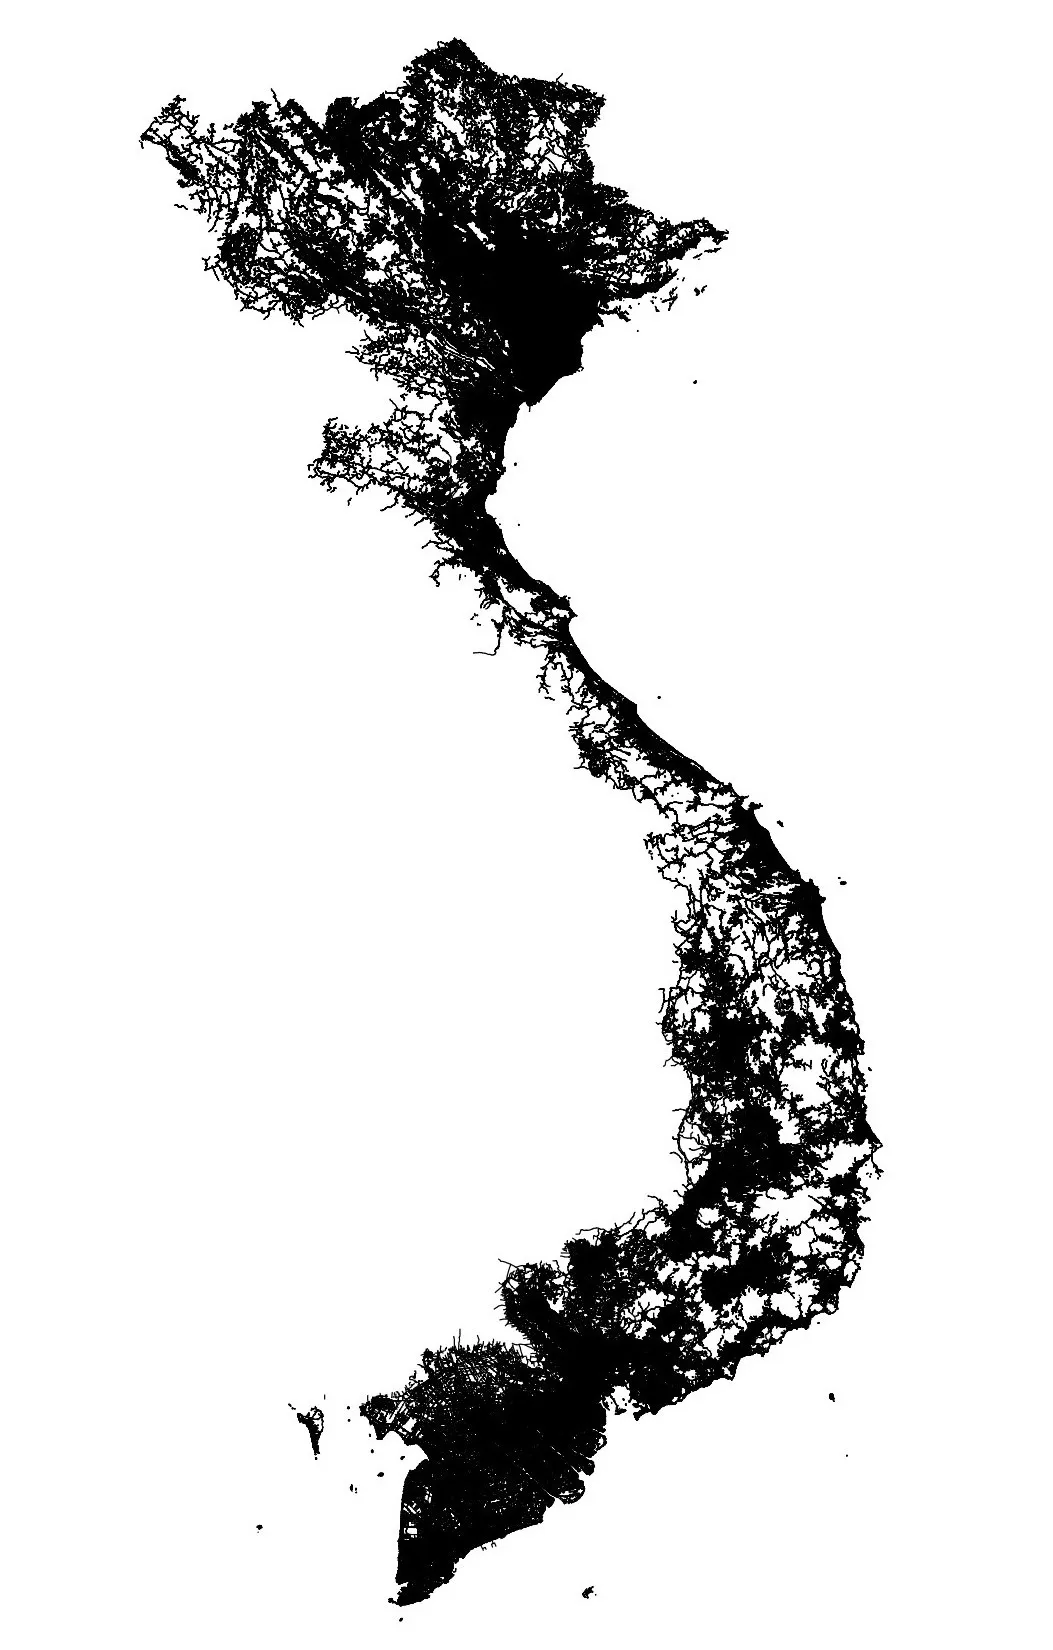
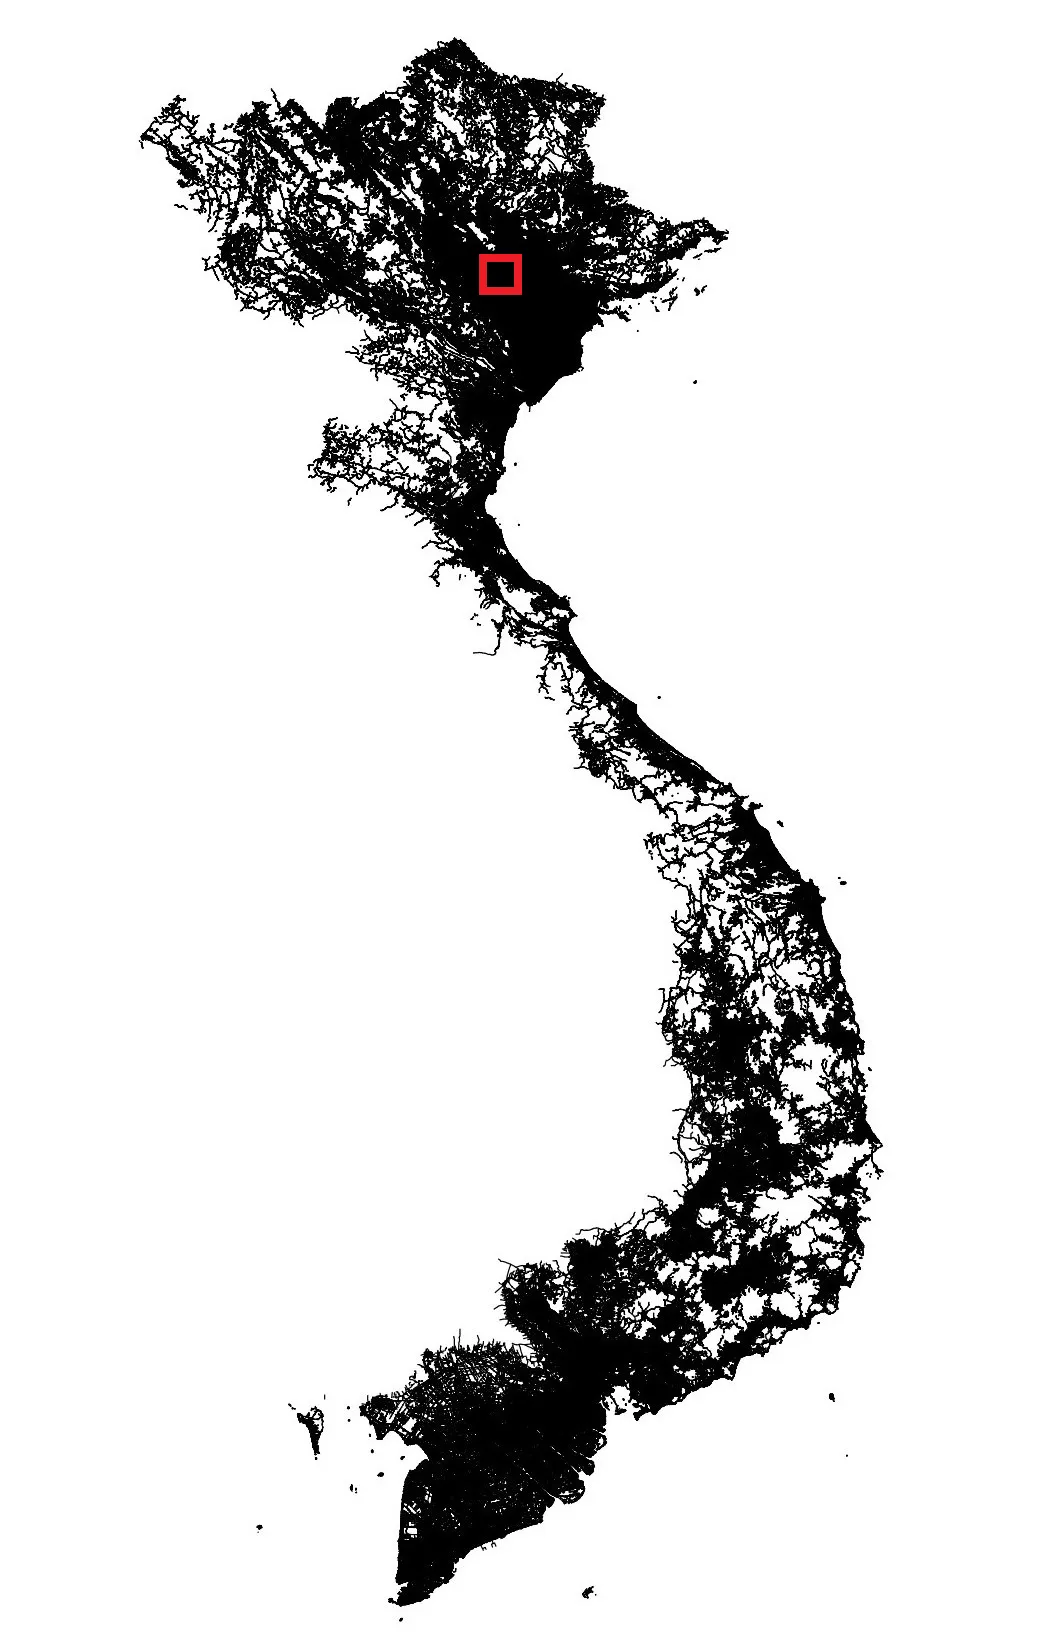
First, one must find an existing open-data network layer in a vector format. For example, the Vietnam road layer (a 646 MB shapefile containing about 3 million links) can be found at Geofabrik (or OSM Wiki). We retain only the Hanoi region, totaling approximately 120 000 links.
Step 2 : Preparing the Road Network Layer
The raw network data is not ready for immediate use because :
- Topological Errors : Some links cross intersections without a node connection (they intersect visually but are not logically linked)
- Directionality : All sections are one-way only (in a GIS each section is represented by a directional or one-way link)
- Categorization : Road classification is too simplified
| Some vocabulary | 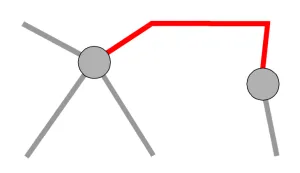 | 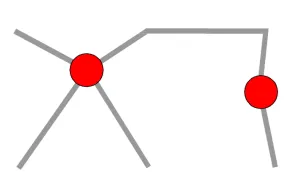 | 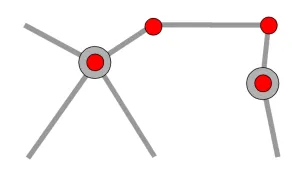 |
| In graph theory | edge A bidirectional edge is a line A directed edge is an arc or an arrow | node or endpoint | Vertex / vertices They are only shape nodes |
| In civil engineering or road management | section | junction | |
| In GIS (QGIS, Q-Traf) | line / link A line / link is always directional (one-way) (since a link is defined by an ordered sequence of vertices) 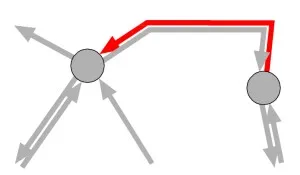 | node or end link | Vertex / vertices |
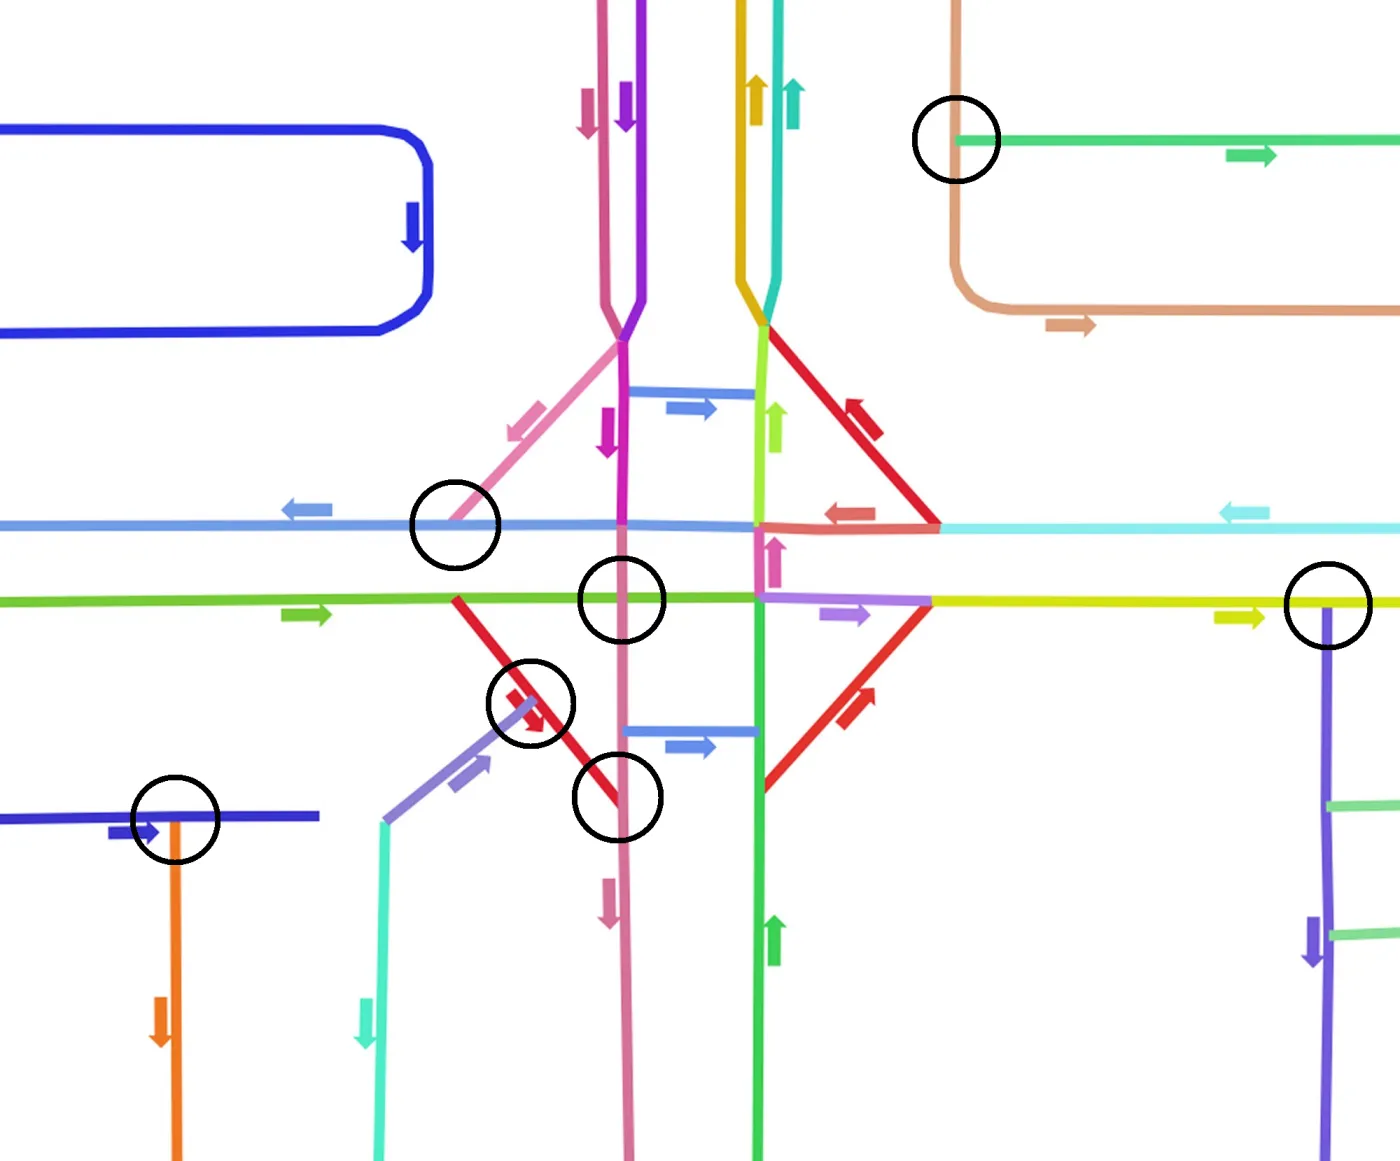
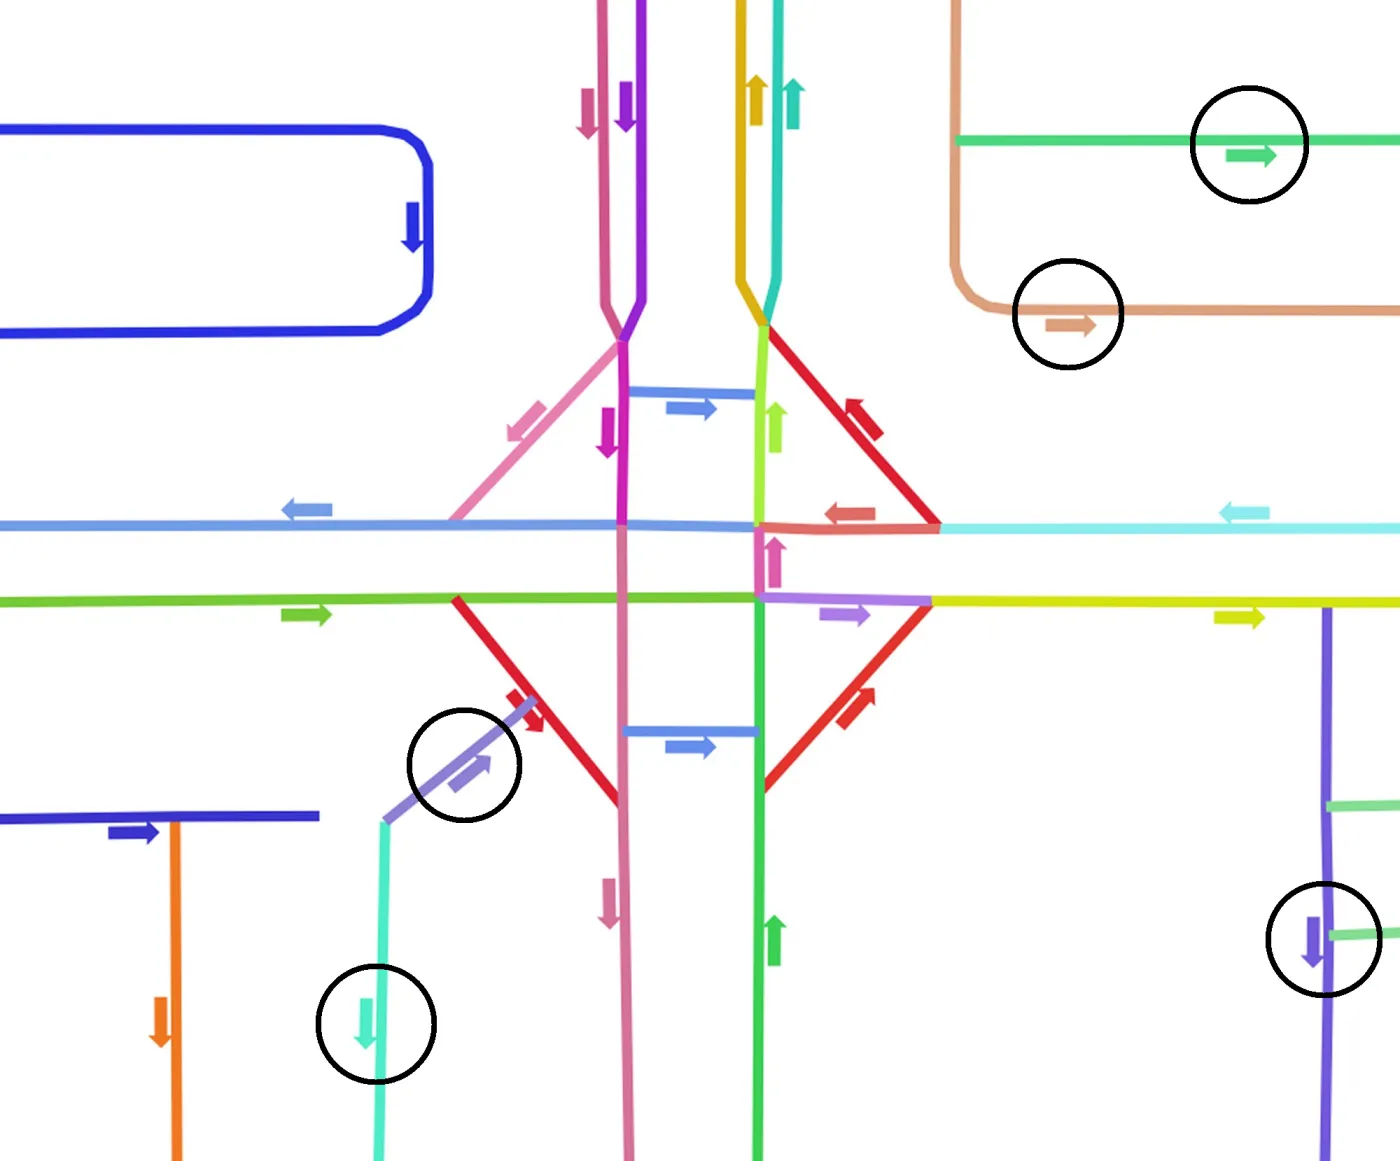
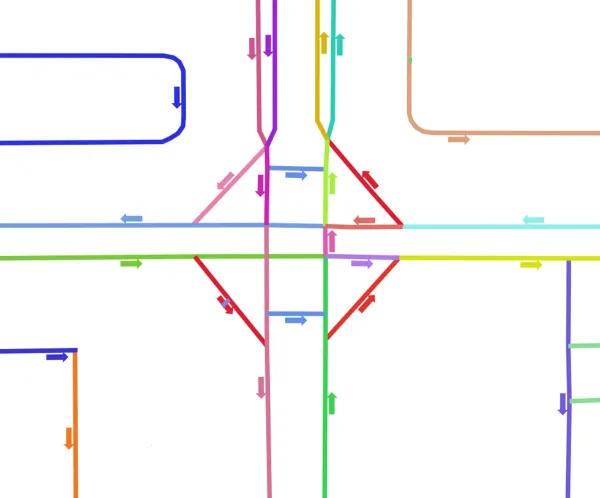
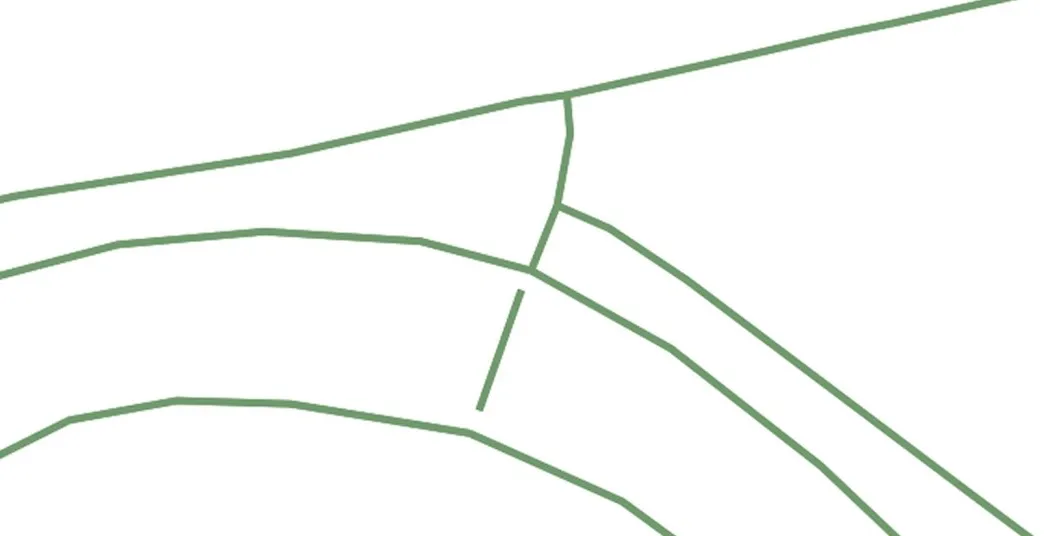
On this figures : One color = One link / line
Some sections / links are too long, and don’t connect to each other (no common end link / node) :
By default, all sections / streets are one-way (since they are represented by only one directional link) :
It is easily corrected in QGIS :
- Splitting : Use the QGIS tool “Split with Lines” to ensure all intersecting lines are cut into elementary links at junctions (nodes) (in QGIS : Duplicate the layer, then apply the second layer on the first one).
- Directionality : In Q-Traf and QGis, a link is a one-way road. Links (as ordered sequence of vertices, with a beginning and an end) are directional. So a two-way lanes require two separate links in opposite directions. In QGIS :
- Duplicate the links layer
- Apply the “Reverse line direction” tool to the second layer
- Merge the 2 layers (“combine multiple vector layers » into a single one)
Caution : Divided highways, interchanges, ramps, roundabouts, … are one-way and should not be duplicated. If so, it will be necessary to “clean” all of them by deleting the “wrong” way, which can take a lot of time. A faster solution is to create a “One-Way” attribute field, separate these sections from the two-way roads (in two separate layers), and only duplicate/reverse the two-way links layer.
Start layer :
Corrected layer :
At this stage, the Hanoi network expands to approximately 350 000 links.
Step 3 : Categorizing Links
The original layer includes tags (pedestrian, cycle path, etc.) that allow to separate major routes from local service roads :
- Major Routes (~50 000 links, in blue) : Motorways, interchanges, grade-separated routes, dual Carriageways, and main urban arteries
- Local streets (~300 000 links, in red) : Residential streets and cul-de-sacs

The work continues with only the main network (50,000 links are sufficient) ; the links are divided into relevant categories based on their capacity (number of lanes) and maximum speed : highways, interchanges, grade-separated roads, dual carriageways, main roads, …
Step 4 : Initial Assignments
First assignments are performed on the major network (50 000 links) to identify and correct main errors.
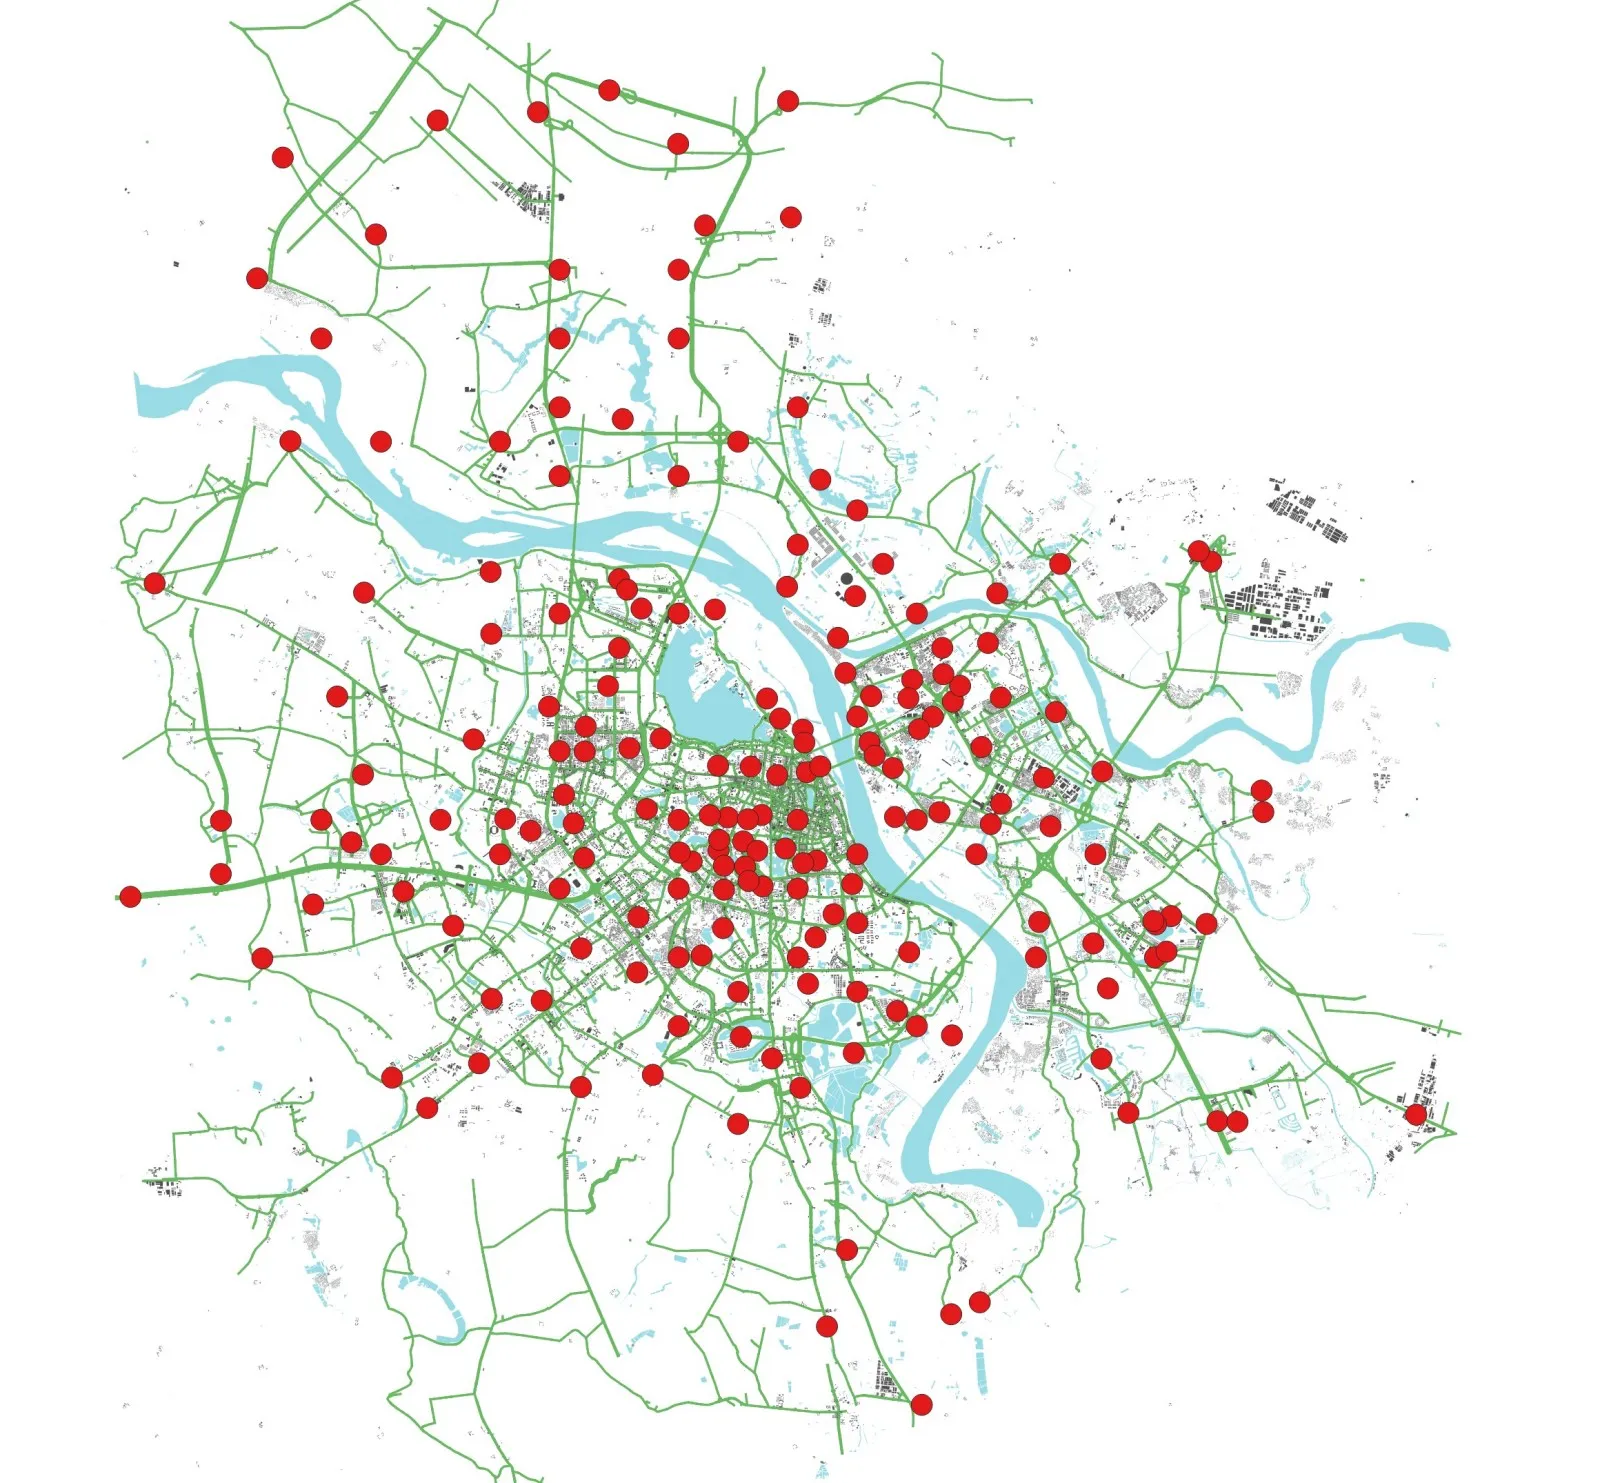
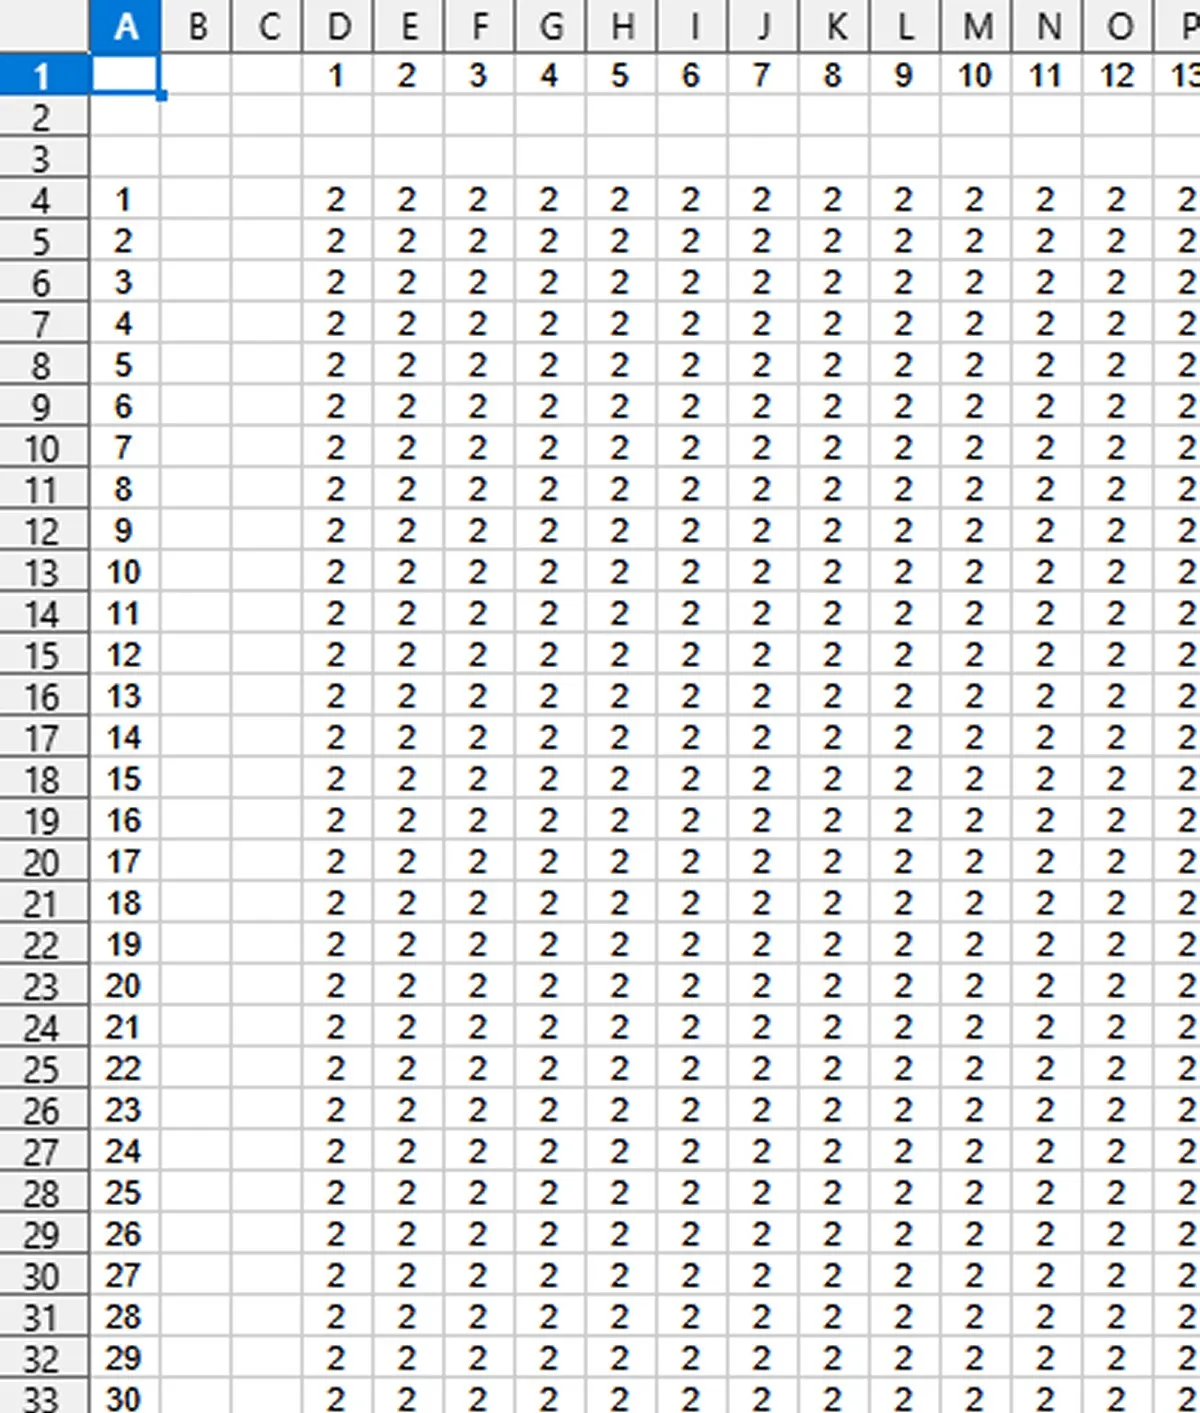
Zoning and Trips Matrix
Approximately 190 OD zones are placed (more or less at random) across the metropolitan area (the “zones” QGIS layer). These are located at motorway termini and high-density built-up areas. A 190×190 matrix filled with “2” is created to simulate car trips between these origins and destinations (OD).
Generic modeling parameters (“parameters.csv” file) are sufficient to obtain a 1st assignment.
First main errors are “bad” connection of 2 types :
- Connectivity Gaps : “Missing” links, or links not connected but very close (1-2 meters gap)
- zones “badly” connected
- Disconnected network parts : Groups of links not connected to the main graph
- Missing Data in the layer : Null values in IDs or categories
Each zone is automatically connected to the nearest link end (node). However, if the nearest link is a one-way link (like a divided carriageway), vehicles may be able to depart but not return (or the opposite)
Many connections / links are missing (generally categorized as secondary route instead of main road), with sections not connected but separated by less than a few meters

These defects are resolved during the cleaning phase.
Step 5 : “Cleaning” the road layer
This is a laborious but essential phase. It involves:
- Connecting snapped or nearly-touching links
- Removing duplicate links
- Slightly moving some zones
- Using aerial imagery to manually correct complex interchanges poorly represented by OSM
Tools for verification:
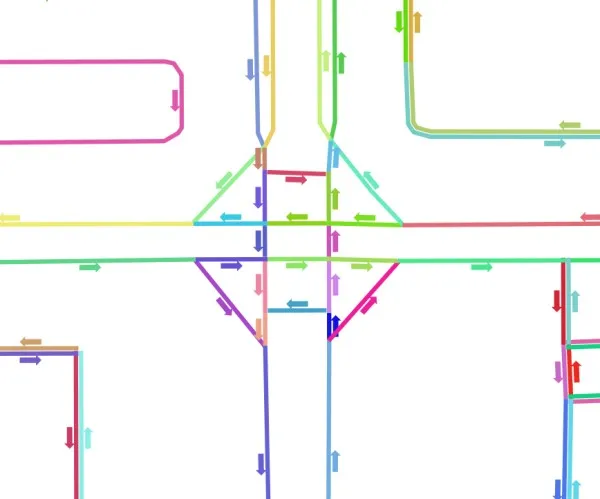
QGIS provides graphical tools for this :
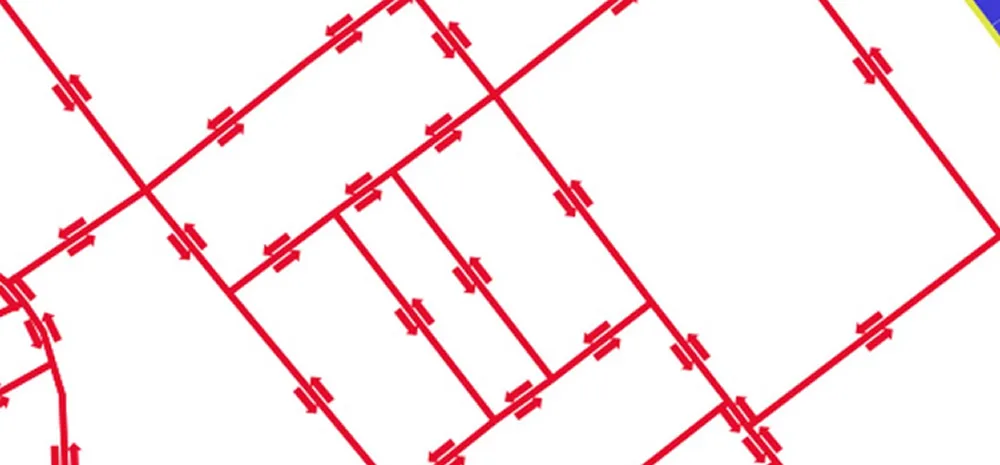
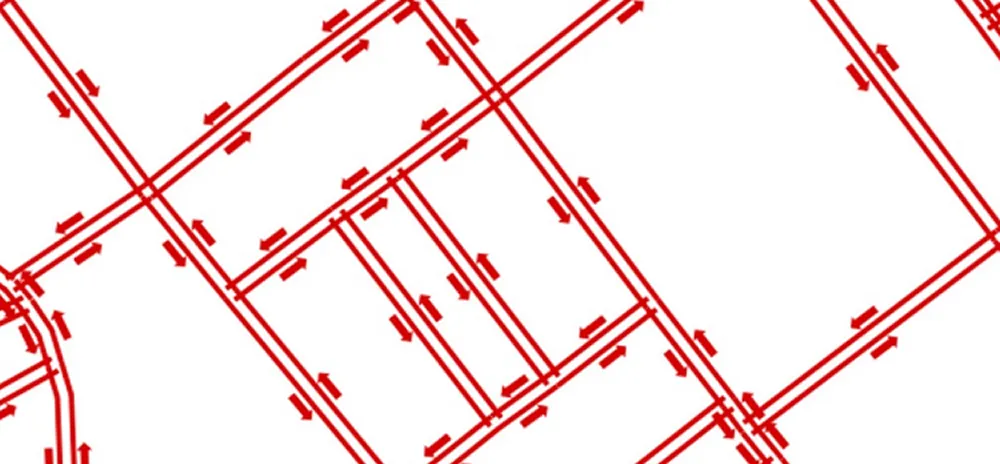
- Display the direction of traffic with arrows (always on the same side of the links)
- Display links with different colors
- Offset (staggering) the 2 opposite direction of the links
The Q-Traf Logs file gives warnings about “Link ends not connected but very close” and “Duplicate links”. For instance :
- WARNING – Links ends not connected but very close :
- 32 links between 1 and 2 meters apart
- 437 links between 2 and 3 meters apart
- First 20 links separated by 1 to 2 meters : 18118 18126 18126 18623 19005 19274 19274 20001 20016 21195 22704 …
- WARNING – 23 duplicate links : 11890 14362 14977 15071 15243 15337 15338 17951 19056 19057 19077 19081 …
Step 6 : Categorization and first usable network layer and Modeling
Results improve with cycles of assignment / correction, and a better (more detailed) categorization of the links.
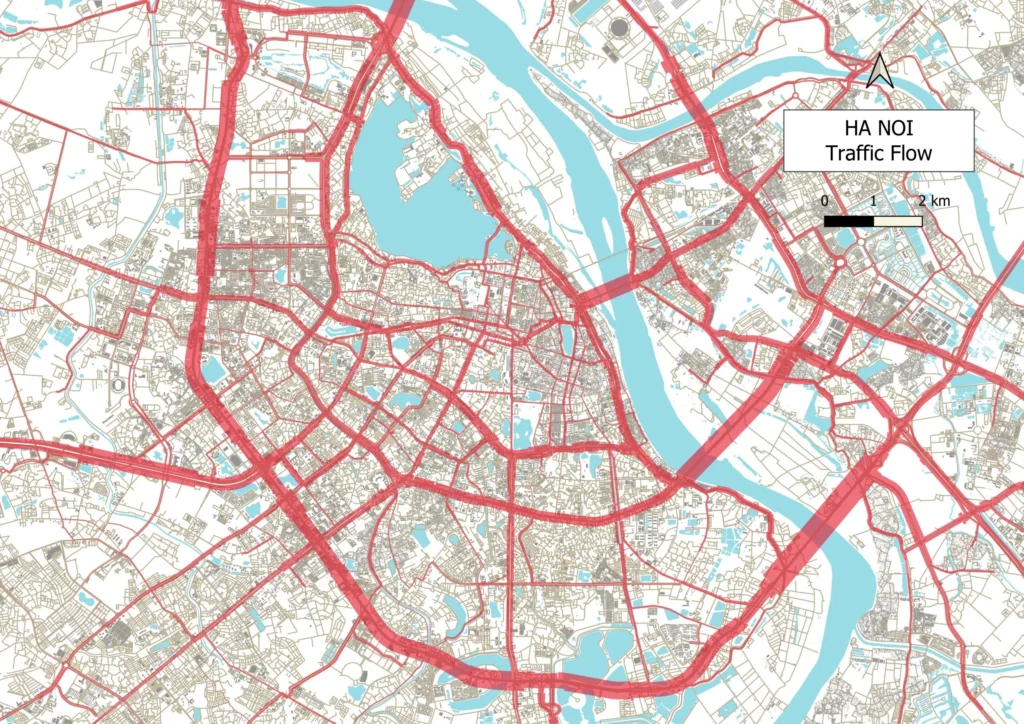
Here the current result with the 50 000 links of the main network (and the zones and the matrix described above) :

=> Attention : This map is provided for illustrative purposes and work material only, and may not be representative of actual road traffic, as the trips and traffic counts are unknown at this stage.
But this is a solid foundation to keep on improving :
- The model runs successfully with the primary 50 000-link network
- There is no more major topological errors
Warning : This is a base tool, not the final result :
- The network must be more precisely specified (mainly more categories ; number of lanes, capacity, etc)
- The complex work of constructing realistic trip matrices—the other major step—still remains
- (and of course confronting the model with traffic counts)
Downloads
You can download this ongoing project here (in its current state, with only the 50 000 main links – 3.5 Mb) (you need Q-Traf and QGIS to use it ; see Download_Q-Traf).
Warning : The computation time with Q-Traf is about 5 minutes

You can download the complete road network layer here (in its current state, with the 350 000 links, in geojson format – 6 MB). Do not use it directly in Q-Traf as the 350 000 links will certainly exceed the available memory)
